


Menu
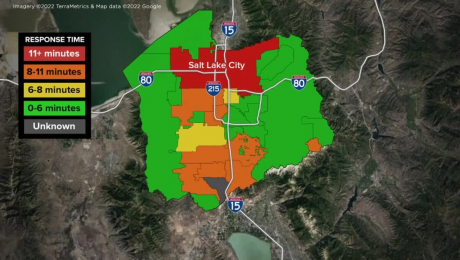
SALT LAKE CITY — For more than a year, FOX 13 News has been investigating slow response times within the Salt Lake City Police Department.
As part of our latest investigation, FOX 13 News compiled a statewide database to track response times for all Utah police departments.
The following data tracks average Priority 1 response times from September 2021 through September 2022 and was obtained through a series of approximately 100 individually-filed requests for public records under Utah law.
Definitions
For the purposes of this database:
“Priority 1” refers to the calls officers are dispatched to with the highest urgency, as defined by department policy.
Observations
Some departments indicated they treat all calls equally or do not use the Priority system. In such cases, FOX 13 News asked agencies to provide data for all calls.
Two of the 90 departments declined our request for public records. FOX 13 News is appealing both denials.
At least six of the 90 departments indicated they did not feel their own response time data was fully accurate.
More than a dozen agencies cited a technical issue with their software. Some have stated our request has prompted them to make changes within their departments.
Many departments asked for the ability to provide context to the numbers and responses they’ve provided. See below.
Alta Marshal’s Office
10:20
Goal: 5 min after dispatch
“(Our) goal is heavily influenced by weather and terrain in Little Cottonwood Canyon,” wrote Town Marshal Mike Morey. “For example, the seasonal Albion Basin Road is only accessible by emergency motor vehicles when it is not covered by deep snow. What may be a 5-minute response in the summer by vehicle, can be a 30-minute or more hike in during winter. The same is true for other mountainous terrain in Alta and Little Cottonwood Canyon.”
American Fork PD
20:54 (all calls)
Goal: N/A
“We do not typically run reports or compile information on our response times,” wrote Adam Ellison, a program manager for the department. “Our agency does not treat every call the same; obviously different calls will have a different level of urgency and priority. However, because our agency does not use a formally ranked priority system of calls, I have done my best to accommodate your request by running a report that shows the average respones time for ALL CALLS.”
“We may not consistently run reports that indicate, to the second, our average response times,” wrote Chief Cameron Paul. “However, we as senior leadership work often enough with our officers, monitor radio traffic and dispatched CAD calls sufficiently, and review individual response times on certain cases to such an extent that we know our officers are responding as quickly and as safely as possible to priority details.”
Aurora PD
9:50 (all calls)
Goal: N/A
“Our circumstance is unique in the state as we are a part-time police department serving just a bit over 1,016 residents,” wrote Chief Matt McLean. “A majority of our calls are also back-up for Salina City PD or the County Sheriff. We currently have two part-time employees with the police department including myself as Chief. When not in service the County Sheriff covers calls in Aurora.”
Blanding PD
anecdotally, within 2 minutes
Goal: N/A
“Blanding had 22 calls that I pulled our numbers from,” wrote Chief J.J. Bradford. “Moving forward with our new dispatch, getting more exact times will be something we can do much more efficiently.”
Bluffdale PD
Did not respond
Goal: N/A
Bluffdale PD is a precinct of Saratoga Springs PD.
“An average response time for priority 1 calls cannot be given,” wrote administrative assistant Cristy Soper. “As a department, we do not have a definition of a ‘priority 1’ response and have wrestled with this concept in the past without a solution.”
The department has not yet responded to our request for data encompassing all calls.
Bountiful PD
6:53 (all calls, Jan 2021 – Dec 2021)
Goal: 7 min
Bountiful PD handles dispatch services for the cities of Bountiful, Centerville, North Salt Lake, West Bountiful, and Woods Cross.
Chief Ed Biehler cited a deficiency with the department’s “outdated” software as a reason why it could not provide response time data from September 2021 through September 2022.
As a consolation, Biehler provided data from a report manually created by a Bountiful PD employee to track response times from January 2021 through December 2021.
He anticipates the department will implement new software in 2023 to fix the problem.
Brian Head Public Safety
13:30 or 19:05 **
Goal: 7 min if three deputies, 12 min if two deputies, 15 min if one deputy
“What we call ‘Priority 1 Calls’ is quite different than what many other agencies do,” wrote Dan Benson, the town’s director of public safety. “A Priority 1 call for us could be a utility problem (broken gas line, power outage, etc.) and we will respond to it, but it would be up to the deputy working to determine the urgency of the response.”
In response to the request, the agency provided two numbers. FOX 13 News is seeking clarification as to which figure is accurate.
Brigham City PD
4:55
Goal: 4 min
“(The request) ended up being more of a manual process than I had anticipated,” wrote Susie Zecca, a records clerk for the department. “It did show us, however, the need to clarify, within the system, what is a priority call, and what is not.”
Cedar City PD
14:30
Goal: < 5 min
Dispatch – 7:59
Travel – 6:31
The department believes “alarms” and “911 hangups” have lowered the average.
Centerville PD
anecdotally, within 4 minutes
Goal: N/A
Centerville PD said it could not retrieve data because of a technical deficiency with Bountiful PD’s software, which is expected to be replaced in 2023.
Bountiful PD handles dispatch services for the cities of Bountiful, Centerville, North Salt Lake, West Bountiful, and Woods Cross.
Clearfield PD
6:18
Goal: < 5 min
Clinton PD
2:29
Goal: N/A
Cottonwood Heights PD
3:41
Goal: 4 min
Cottonwood Heights PD also compiles and presents detailed monthly reports to the city council.
Draper PD
8:19
Goal: N/A
Dispatch – 2:49
Travel – 5:30
East Carbon PD
anecdotally, within 2-3 minutes of dispatch
Goal: N/A
“I was not able to get accurate information on our response times,” wrote Chief Sam Leonard. “The data was way off. I talked with our dispatch center and they were not able to help me with accurate response times. I also talked with our software provider Eforce, and they were not sure why the data was so far off… I do not have a response time goal because our response time has never been questionable. I have been with East Carbon Police Dept. for 32 years.”
Enoch PD
6:58
Goal: < 5 min
Ephraim PD
Unknown
Goal: 3 min
“We appreciate your request because it has helped discover a current problem in our data entry process,” wrote Lynsey Zeeman, an administrative assistant for the department. “Because of your request allowing us to discover that data was entered manually into our officer’s reports, but not transferred to the system for electronic storage and retrieval, the data requested is not available electronically for this year in an accurate form… Sanpete County Dispatch provides the dispatching service for all the departments in Sanpete County, including Ephraim PD. The Dispatch supervisor explained to me that the way they report the response times are through the dispatch notes. So, the response time analysis report would be inaccurate, since they are using the notes to document all dispatch related notes.”
The department only has one officer working during the evening hours, according to Chief Aaron Broomhead.
Fairview PD
8:12
Goal: 5 min if on duty, 10 min if on call
Fairview PD does not have 24/7 coverage.
“There are a lot of times however when a call comes out and dispatch has to call out our officer but the neighboring agency (Mount Pleasant) Has someone on duty and sends them to hold the scene,” wrote Chief Steve Gray. “Their response is typically under 7 min on those calls.”
Farmington PD
2:05 or 7:08
Goal: N/A
The Davis County Sheriff’s Office, which handles dispatching services for Farmington PD, listed a 2:05 response time.
A record provided by Chief Eric Johnsen listed a 7:08 response time.
“Not sure what FPD used as parameters, but the official time is 2:05 minutes for priority one calls,” wrote Perry M. Koger, the DCSO administrator who compiled the data.
Granite School District PD
8:32
Goal: N/A
“Because our schools are also served by SROs from other agencies, our actual police response varies dramatically as a call might be responded to initially by an SRO from (for example) Unified Police or Taylorsville PD as opposed to an actual Granite Officer,” wrote Ben Horsley, a spokesperson for the district. “We don’t have the ability to track those times so our response times are simply for our officers responses to the various priority 1 calls we have or respond to.”
Grantsville PD
9:05
Goal: N/A
Gunnison Valley PD
UNKNOWN
Goal: has not responded
“I spoke with Neil Johnson at the Sanpete County Sheriff’s Department and he informed me that with the current CAD we have the response times are recorded in the ‘notes’ and there is no way to pull a report,” wrote Tammy Winegar, a records manager for the department. “They are currently working on making a change so that those reports can be accessed.”
Harrisville PD
3:11
Goal: 3 min
Heber City PD
3:12
Goal: 4-5 min
Helper PD
2:06
Goal: 3-5 min
Herriman PD
8:26
Goal: N/A
Dispatch – 2:53
Travel – 5:33
“Setting a specific (goal) time is not in the best interest of the community, as a safe arrival, based on varying circumstances, is of greater public service than an officer attempting to meet an expected time, leading to an unsafe or unrealistic response,” wrote Chief Troy D. Carr.
Hurricane PD
REQUEST DENIED
Goal: REQUEST DENIED
Hurricane PD denied the request, citing a number of reasons.
For example, the department believes the data is not public because it is “regarding security measures” and “because the disclosure of the information would jeopardize the life or safety of an individual.”
FOX 13 News has filed an appeal, noting that the statute cited by Hurricane PD is specifically intended to protect “security plans… to prepare for or mitigate terrorist activity.”
Kamas PD
Has not responded
“The amount of time it takes for this request is significant so I have not had time to process it,” wrote Chief Brad Smith. “To get these numbers I need to go through each call individually and look at the times. It could take hours. I am sorry that we are not staffed enough to process this timely.”
Kanab PD
anecdotally, under 5 minutes
Goal: 5 min
Chief Tom Cram described his response as “just off the cuff without thorough research.”
FOX 13 News asked why the department was not able to retrieve exact data but did not receive any further explanation.
“Sorry this is the best I can do at this time,” Chief Cram wrote. “It is pretty accurate.”
Kaysville PD
1:26
Goal: has not responded
The Davis County Sheriff’s Office, which handles dispatching services for Kaysville PD, listed a 1:27 response time.
A record provided by Kaysville PD listed a 1:26 response time.
La Verkin PD
7:07
Goal: N/A
Layton PD
3:15
Goal: N/A
“Normally I’m reluctant to provide a number that I don’t have full confidence in,” wrote Karl Kuehn, a communications manager for the city. “The problem with (our) report is that the software doesn’t display the underlying data that is used to derive the response time… There are some other situations that may cause a ‘Priority 1’ call to hold for a long time, because it’s classified one way, but the circumstances indicate it is not emergent and does not require an immediate response.”
Layon PD indicated it is looking into developing a custom report to track response times in the future.
“Regarding our data specifically, one of our practices is to change the priority of a call to a ‘9’ after it has been handled, but the officer will finish the call/investigation/documentation later. We do this frequently, and those calls are not included in this statistic, because they are no longer showing as a Priority 1,” Kuehn continued. “I do not have full confidence in this number.”
Lehi PD
8:37
Goal: 8:30
Lindon PD
5:13
Goal: N/A
Logan PD
7:34
Goal: 4:30
Lone Peak PD
5:50
Goal: N/A
Mantua PD
9:30
Goal: < 5 min
Mapleton PD
4:10
Goal: N/A
Moab PD
8:05
Goal: < 5 min
Moab PD spent several weeks working with FOX 13 News to overcome newly-identified deficiencies with its software. Ultimately, FOX 13 News calculated the average Priority 1 response time with data provided by the department.
“We are in the process of obtaining a new records management system which will give us better insight on how we are performing on response,” wrote Chief Jared Garica.
Mt. Pleasant PD
4:08 (all calls)
Goal: N/A
“Our system does not compile priority response time separately,” wrote police secretary Cari Bennett.
Murray PD
1:24
Goal: N/A
Naples PD
UNKNOWN
Goal: N/A
“I am working on this data. It isn’t specifically tracked in our area,” wrote evidence manager Kimberly Kay. “It’s more of a technical issue. I believe the data is somewhere, I just don’t have an answer for exactly how to get it. I have since reached out to a couple of sources to attempt to get the info. I apologize for both the delay and the confusion. I am the only data-type person at our agency, and I’ve never encountered this request before. I will hopefully be able to tell you something either way by (October) 31st.”
Nephi PD
13:53 (all calls)
Goal: N/A
“We do not have a definition of a priority 1 response. Each non-emergent, urgent, and emergent call for service is different and may dictate a varied response,” wrote Sgt. Joshua Morrow. “I understand that dispatch has a priority designation for POLICE, FIRE and EMS. However, these priorities do not match up with what we would consider priority calls. Reason being is because EMS and FIRE priority calls would differ from Law Enforcement priority.”
North Ogden PD
2:06
Goal: 5 min
North Park PD
10:02
Goal: 15 min
According to the provided data, North Park PD has the least-ambitious Priority 1 response goal in Utah.
North Salt Lake PD
UNKNOWN
Goal: N/A
North Salt Lake PD said it could not retrieve data because of a technical deficiency with Bountiful PD’s software, which is expected to be replaced in 2023.
Bountiful PD handles dispatch services for the cities of Bountiful, Centerville, North Salt Lake, West Bountiful, and Woods Cross.
Ogden PD
4:57
Goal: N/A
Orem PD
7:58
Goal: N/A
Park City PD
1:43
Goal: N/A
Parowan PD
13:46
Goal: N/A
“After speaking with dispatch I have been informed that these times are not completely accurate due to the different natures of priority 1 calls,” wrote Nicole Hynson, an administrative assistant for the department.
Hynson said she believes the 6:18 dispatch time listed in the report she provided should be “more like under 1 min” and that the 7:27 travel time should be “more like under 5 min.”
Payson PD
16:22
Goal: N/A
“We acknowledge that Central Utah 911 utilizes a priority designation for police through Spillman. However, these priorities do not match up consistently with what our agency would consider as priority calls,” wrote Lynette Mortensen, a senior executive assistant for Payson PD. “We feel this report does not reflect accurate response times, due to variables beyond our control. However, this is all we have to provide for you at this time.”
Perry PD
5:47
Goal: 3 min
Pleasant Grove PD
5:56
Goal: has not responded
Dispatch – 1:14
Travel – 4:42
Pleasant View PD
3:46
Goal: N/A
Price PD
anecdotally, 2-3 minutes
Goal: 2-3 minutes
“Price Police does not keep records for response times, unless it is documented within the narrative of any such respective report,” wrote Chief Brandon Sicilia. “You may have better luck sending your request to the section 33 dispatch center. They dispatch for all of our first responder agencies within Carbon County and store records of all call times.”
FOX 13 News asked for clarification as to why Price PD would not have its own response time data from dispatch, but the question was ignored.
Provo PD
9:47
Goal: N/A
Richfield PD
6:48
Goal: N/A
Riverdale PD
3:30
Goal: 3 min
Riverton PD
9:12
Goal: N/A
Dispatch – 3:44
Travel – 5:28
“It would be contradictory and potentially dangerous to have a policy or procedure in place mandating a set response time as officers may drive unsafely in an attempt to arrive more quickly,” wrote Chief Don Hutson. “The numbers provided in the report were extrapolated from the Versaterm database and have not been edited to remove cases that may have been classified incorrectly or not input correctly, so there is a margin of error.”
Chief Hutson credited the Salt Lake Valley Emergency Communications Center (VECC) for their efforts in recently improving its dispatch times over the past year.
“We are committed to frequently evaluating our response strategies to identify opportunities to reduce the amount of time it takes to respond to emergency calls and we look forward to working with our partners and continuing that practice moving forward.”
Roosevelt PD
0:56
Goal: 1 min
Roy PD
5:17 (Jan 2021 – Dec 2021)
Goal: N/A
“I recently completed our annual report to the city council which included response times for the calendar year 2021,” wrote Chief Matthew Gwynn. “While not September through September like your request asks, I’m not inclined to believe that there would be a statistically significant shift in our response time from what we collected versus what you asked for. I hope this is okay.”
FOX 13 News asked if the department is also able to compile a report with the requested information, but Roy PD has not responded.
Salem PD
4:46 (all calls)
Goal: N/A
“The Salem Police Department does not define calls by a priority type response like the Central Utah 911 Dispatch,” wrote police secretary Stacy Bliss.
Salina City PD
14:04 (all calls)
Goal: N/A
“Salina City Police Department is a small agency and all our calls are prioritized the same. We don’t have a Priority 1 call,” wrote officer manager Hillary Anderson. “As an average response time goal Chief is planning on reviewing everything again and setting a goal for the department.”
Salt Lake City PD
11:58
Goal: 10 min
The Salt Lake City Police Department had a goal of 4-5 minutes in 2021, according to Sgt. Keith Horrocks.
The department has since disputed our reporting.
READ: Salt Lake City lowers the bar for police response times
READ: SLCPD response times lag amid officer shortage
Sandy PD
8:50
Goal: N/A
Santa Clara – Ivins PD
7:17
Goal: N/A
Santaquin PD
9:54
Goal: N/A
Saratoga Springs PD
7:34
Goal: 7 minutes
“Data concerning response times are available to us through research of dispatch center records but are often found to be questionable based on a variety of factors such as an error in reporting, specific call details changing the nature of the response, failure to record the arrival time, etc.,” wrote administrative assistant Cristy Soper.
Smithfield PD
anecdotally, 2.5 minutes
Goal: N/A
“For me to task an employee with going through a years’ worth of reports to obtain the information you are requesting takes a substantial amount of time,” wrote Chief Travis K. Allen.
South Jordan PD
9:11
Goal: N/A
Dispatch – 3:07
Travel – 6:04
South Ogden PD
4:01
Goal: 4 min
South Salt Lake PD
7:17
Goal: < 10 min
Spanish Fork PD
2:33
Goal: 4 min
Springdale PD
8:56
Goal: N/A
Springville PD
UNKNOWN
Goal: 5 min
“Unfortunately our system does not capture accurate time stamps on some of our calls for service,” wrote Chief Lance Haight. “Our Computer Aided Dispatch (CAD) system does calculate response times based on data entered, but response time stamps are dependent on officers and/or dispatchers making a manual entry. Amid the data, there are incidents when the time stamps are not entered in a timely manner, which skews the data. It would take extensive time to manually review all of our incidents. We can certainly look at specific incidents to determine our actual response time, but we do not have the resources to conduct that level of review for each and every incident. As a result, we are unable to give you an accurate response time average.”
Chief Haight stated he is also looking into the possibility of coding calls differently for active incidents versus incidents that are no longer active.
“We will audit calls to assess if we are meeting our response goal.”
St. George PD
19:22
Goal: N/A
According to the provided data, St. George PD has the slowest average Priority 1 response in Utah.
FOX 13 News has asked for clarification and plans to continue reporting.
Sunset PD
1:50
Goal: 3 min
Data provided by the Davis County Sheriff’s Office, which handles dispatching services for Sunset PD.
Syracuse PD
2:28
Goal: N/A
Data provided by the Davis County Sheriff’s Office, which handles dispatching services for Syracuse PD.
Taylorsville PD
8:33
Goal: N/A
Dispatch – 3:44
Travel – 4:50
Tooele PD
10:41
Goal: N/A
FOX 13 News calculated the average Priority 1 response time with data provided by the department.
“Please keep in mind that not all of these times are accurate, seeing as there are many times when dispatch doesn’t mark us as arrived,” wrote Cpl. Colbey Bentley. ”The calls where you are seeing a long wait time is due to an officer not being marked as arrived. This happens from time to time when our dispatch center is extremely busy.”
Tremonton PD
5:52
Goal: N/A
FOX 13 News calculated the average Priority 1 response time with data provided by the department.
“There are some calls that are a little out of the normal, like you will see where we had a stabbing/gun shot case and the response time was 31 minutes,” wrote Assistant Chief Brian Crockett. “Our first officers were there with in just a few minutes, but because people were called out from home and it took them 31 minutes to get there it messed up the time. So there are some weird numbers, but most of it looks pretty normal from my perspective.”
Unified PD
5:01
Goal: N/A
Dispatch – 2:02
Travel – 2:59
Vernal PD
anecdotally, 4 minutes
Goal: 3-5 min
“I’m trying to determine a way to track time for initial officer on scene,” wrote Chief Keith Campbell. “Our dispatch system tracks all officers that respond and averages them. Then reports average time overall per call. If an officer arrives 10 minutes later and checks out on the call it changes the numbers drastically. For example, initial officer on scene in under 2 minutes, 4 officers assisted on the case. It shows response time of 27 minutes. The second two officers arrived on scene way late to assist with vehicle tow and other issues.”
Washington City PD
7:53
Goal: < 10 min
Wellington PD
1:29:48 (all calls)
Goal: N/A
“We do not have just a priority 1 call. Our reporting system is fed through dispatch on times dispatched, arrived and cleared,“ wrote Chief Tom Kosmack. ”Because we don’t have a call volumes as some departments, we don’t have the need to distinguish calls as priority 1, 2, or 3.”
Chief Kosmack stated the department has recently hired a third officer to meet the city’s needs.
“This officer now has completed his first full week now,” he wrote. “My only goal would be to continue to represent Wellington Police as they have and always seek improvement as needed.
West Bountiful PD
UNKNOWN
Goal: 5 min
West Bountiful PD said it could not retrieve data because of a technical deficiency with Bountiful PD’s software, which is expected to be replaced in 2023.
Bountiful PD handles dispatch services for the cities of Bountiful, Centerville, North Salt Lake, West Bountiful, and Woods Cross.
West Jordan PD
8:00
Goal: N/A
Dispatch — 4:00
Travel – 4:00
West Valley City PD
9:48 (median, Jan 2021 – Dec 2021)
Goal: has not responded
Roxeanne Vainuku, a spokesperson for the department, initially approved the request but then changed her mind when asked by FOX 13 News to provide a response within the deadline outlined in state law.
Instead, West Valley City PD provided a median response time from January 2021 through December 2021.
“I mistakenly asked for a record, which did not exist, to be created in an effort go above and beyond your request. I should not have done that. I will not do it again,” Vainuku wrote. ”I will certainly be careful not to try and assist beyond the specific requirements of GRAMA in the future.”
FOX 13 News is in the process of filing an appeal.
Willard PD
12:13
Goal: 8 min if on duty, 25 min if off duty
FOX 13 News calculated the average Priority 1 response time with data provided by the department.
“It’s hard for me to set a goal as we do not have an officer on 24 hours a day,” wrote Chief Theron Fielding. “Some of our calls are late and night and we get called out.”
Woods Cross PD
7:17
Goal: 6 min
The information in the attachment isn’t going to be 100 percent accurate due to some factors,” wrote Michelle Rowley, an administrative assistant and evidence technician for the department. “Our dispatch center does not have the same RMS system as we do. Dispatch’s Eforce system does not properly communicate with Spillman all the time. There have been times that we have arrived on scene and dispatch doesn’t show the officers as arrived for many minutes after.”
DUBLIN, Oct. 27, 2022 /PRNewswire/ — The "Enterprise Content Management System Market By Solution, By Deployment Mode, By Enterprise Size, By Industry Vertical: Global Opportunity Analysis and Industry Forecast, 2020-2030" report has been added to ResearchAndMarkets.com's offering.
According to this report the enterprise content management system market was valued at $21.5 billion in 2020, and is estimated to reach $53.2 billion by 2030, growing at a CAGR of 9.8% from 2021 to 2030.
Enterprise content management is used to manage, capture, store, preserve, and deliver content to organizational processes. Enterprise content management reduces workload of organization by maintaining & processing the complex workflow, increase operational efficiency, and enhance customer experience. Furthermore, demand for enterprise content management system is increasing, owing to its features, including securing the stress content and integration of content with business intelligence & business analytics application.
The enterprise content management system market is expected to experience significant growth during the forecast period, owing to increase in need for digital content with the proliferation of online marketing and online customer relationship. Moreover, constant development of the e-commerce industry fuels the demand for enterprise content management systems to store, manage, create, and distribute digital content through online channels.
In addition, increase in adoption of cloud-based enterprise content management system is expected to boost the enterprise content management system market growth in the future. However, high initial costs of implementation and lack of awareness to implement the right solution for the specific needs among small and medium-sized enterprises (SMEs) hinder the growth of enterprise content management system market.
The enterprise content management system market is segmented on the basis of solution, deployment mode, enterprise size, industry vertical, and region. According to solution, it is fragmented into records management, case management, document management, mobile content management, imaging & capturing, web content management, digital asset management, and others.
On the basis of deployment mode, it is bifurcated into on-premise and cloud. By enterprise size, it is categorized into large enterprises and small & medium enterprises. As per industry vertical, it is classified into BFSI, IT & telecom, energy & utilities, government and public sector, healthcare and life sciences, retail and consumer goods, manufacturing, and others. Region wise, it is analyzed across North America, Europe, Asia-Pacific, and LAMEA.
The major players operating in the enterprise content management system market are Adobe, Capgemini, Fabasoft, Hyland Software, Inc., Lexmark International, Inc., Microsoft Corporation, M-Files, Inc., Oracle, Open Text Corporation, and XEROX Corporation.
Key Benefits For Stakeholders
Key Topics Covered:
CHAPTER 1: INTRODUCTION
CHAPTER 2: EXECUTIVE SUMMARY
CHAPTER 3: MARKET OVERVIEW
3.1. Market definition and scope
3.2. Key findings
3.2.1. Top investment pockets
3.3. Porter's five forces analysis
3.4. Top player positioning
3.5. Market dynamics
3.5.1. Drivers
3.5.2. Restraints
3.5.3. Opportunities
3.6. COVID-19 Impact Analysis on the market
CHAPTER 4: ENTERPRISE CONTENT MANAGEMENT SYSTEM MARKET, BY SOLUTION
4.1 Overview
4.1.1 Market size and forecast
4.2 Records Management
4.2.1 Key market trends, growth factors and opportunities
4.2.2 Market size and forecast, by region
4.2.3 Market analysis by country
4.3 Case Management
4.3.1 Key market trends, growth factors and opportunities
4.3.2 Market size and forecast, by region
4.3.3 Market analysis by country
4.4 Document Management
4.4.1 Key market trends, growth factors and opportunities
4.4.2 Market size and forecast, by region
4.4.3 Market analysis by country
4.5 Mobile Content Management
4.5.1 Key market trends, growth factors and opportunities
4.5.2 Market size and forecast, by region
4.5.3 Market analysis by country
4.6 Imaging and Capturing
4.6.1 Key market trends, growth factors and opportunities
4.6.2 Market size and forecast, by region
4.6.3 Market analysis by country
4.7 Web Content Management
4.7.1 Key market trends, growth factors and opportunities
4.7.2 Market size and forecast, by region
4.7.3 Market analysis by country
4.8 Digital Asset Management
4.8.1 Key market trends, growth factors and opportunities
4.8.2 Market size and forecast, by region
4.8.3 Market analysis by country
4.9 Others
4.9.1 Key market trends, growth factors and opportunities
4.9.2 Market size and forecast, by region
4.9.3 Market analysis by country
CHAPTER 5: ENTERPRISE CONTENT MANAGEMENT SYSTEM MARKET, BY DEPLOYMENT MODE
5.1 Overview
5.1.1 Market size and forecast
5.2 On-Premise
5.2.1 Key market trends, growth factors and opportunities
5.2.2 Market size and forecast, by region
5.2.3 Market analysis by country
5.3 Cloud
5.3.1 Key market trends, growth factors and opportunities
5.3.2 Market size and forecast, by region
5.3.3 Market analysis by country
CHAPTER 6: ENTERPRISE CONTENT MANAGEMENT SYSTEM MARKET, BY ENTERPRISE SIZE
6.1 Overview
6.1.1 Market size and forecast
6.2 Large Enterprises
6.2.1 Key market trends, growth factors and opportunities
6.2.2 Market size and forecast, by region
6.2.3 Market analysis by country
6.3 Small & Medium Sized Enterprises
6.3.1 Key market trends, growth factors and opportunities
6.3.2 Market size and forecast, by region
6.3.3 Market analysis by country
CHAPTER 7: ENTERPRISE CONTENT MANAGEMENT SYSTEM MARKET, BY INDUSTRY VERTICAL
7.1 Overview
7.1.1 Market size and forecast
7.2 BFSI
7.2.1 Key market trends, growth factors and opportunities
7.2.2 Market size and forecast, by region
7.2.3 Market analysis by country
7.3 IT and Telecommunication
7.3.1 Key market trends, growth factors and opportunities
7.3.2 Market size and forecast, by region
7.3.3 Market analysis by country
7.4 Energy and Utilities
7.4.1 Key market trends, growth factors and opportunities
7.4.2 Market size and forecast, by region
7.4.3 Market analysis by country
7.5 Government and Public Sector
7.5.1 Key market trends, growth factors and opportunities
7.5.2 Market size and forecast, by region
7.5.3 Market analysis by country
7.6 Healthcare and Life Sciences
7.6.1 Key market trends, growth factors and opportunities
7.6.2 Market size and forecast, by region
7.6.3 Market analysis by country
7.7 Retail and Consumer Goods
7.7.1 Key market trends, growth factors and opportunities
7.7.2 Market size and forecast, by region
7.7.3 Market analysis by country
7.8 Manufacturing
7.8.1 Key market trends, growth factors and opportunities
7.8.2 Market size and forecast, by region
7.8.3 Market analysis by country
7.9 Others
7.9.1 Key market trends, growth factors and opportunities
7.9.2 Market size and forecast, by region
7.9.3 Market analysis by country
CHAPTER 8: ENTERPRISE CONTENT MANAGEMENT SYSTEM MARKET, BY REGION
CHAPTER 9: COMPANY LANDSCAPE
9.1. Introduction
9.2. Top winning strategies
9.3. Product Mapping of Top 10 Player
9.4. Competitive Dashboard
9.5. Competitive Heatmap
9.6. Key developments
CHAPTER 10: COMPANY PROFILES
10.1 Oracle Corporation.
10.1.1 Company overview
10.1.2 Company snapshot
10.1.3 Operating business segments
10.1.4 Product portfolio
10.1.5 Business performance
10.1.6 Key strategic moves and developments
10.2 Hyland Software, Inc.
10.2.1 Company overview
10.2.2 Company snapshot
10.2.3 Operating business segments
10.2.4 Product portfolio
10.2.5 Business performance
10.2.6 Key strategic moves and developments
10.3 Xerox Corporation
10.3.1 Company overview
10.3.2 Company snapshot
10.3.3 Operating business segments
10.3.4 Product portfolio
10.3.5 Business performance
10.3.6 Key strategic moves and developments
10.4 Opentext Corporation
10.4.1 Company overview
10.4.2 Company snapshot
10.4.3 Operating business segments
10.4.4 Product portfolio
10.4.5 Business performance
10.4.6 Key strategic moves and developments
10.5 Alfresco Software, Inc.
10.5.1 Company overview
10.5.2 Company snapshot
10.5.3 Operating business segments
10.5.4 Product portfolio
10.5.5 Business performance
10.5.6 Key strategic moves and developments
10.6 Lexmark International, Inc.
10.6.1 Company overview
10.6.2 Company snapshot
10.6.3 Operating business segments
10.6.4 Product portfolio
10.6.5 Business performance
10.6.6 Key strategic moves and developments
10.7 M-Files Inc.
10.7.1 Company overview
10.7.2 Company snapshot
10.7.3 Operating business segments
10.7.4 Product portfolio
10.7.5 Business performance
10.7.6 Key strategic moves and developments
10.8 Microsoft Corporation
10.8.1 Company overview
10.8.2 Company snapshot
10.8.3 Operating business segments
10.8.4 Product portfolio
10.8.5 Business performance
10.8.6 Key strategic moves and developments
10.9 Adobe Systems Incorporated
10.9.1 Company overview
10.9.2 Company snapshot
10.9.3 Operating business segments
10.9.4 Product portfolio
10.9.5 Business performance
10.9.6 Key strategic moves and developments
10.10 Fabasoft
10.10.1 Company overview
10.10.2 Company snapshot
10.10.3 Operating business segments
10.10.4 Product portfolio
10.10.5 Business performance
10.10.6 Key strategic moves and developments
For more information about this report visit https://www.researchandmarkets.com/r/8nh4mb
Media Contact:
Research and Markets
Laura Wood, Senior Manager
press@researchandmarkets.com
For E.S.T Office Hours Call +1-917-300-0470
For U.S./CAN Toll Free Call +1-800-526-8630
For GMT Office Hours Call +353-1-416-8900
U.S. Fax: 646-607-1904
Fax (outside U.S.): +353-1-481-1716
Logo: https://mma.prnewswire.com/media/539438/Research_and_Markets_Logo.jpg

View original content:https://www.prnewswire.com/news-releases/the-worldwide-enterprise-content-management-system-industry-is-expected-to-reach-53-2-billion-by-2030–301661150.html
SOURCE Research and Markets
© 2022 Benzinga.com. Benzinga does not provide investment advice. All rights reserved.

Register for your free TechRepublic membership or if you are already a member, sign in using your preferred method below.
We recently updated our Terms and Conditions for TechRepublic Premium. By clicking continue, you agree to these updated terms.
Invalid email/username and password combination supplied.
An email has been sent to you with instructions on how to reset your password.
By registering, you agree to the Terms of Use and acknowledge the data practices outlined in the Privacy Policy.
You will also receive a complimentary subscription to TechRepublic’s News and Special Offers newsletter and the Top Story of the Day newsletter. You may unsubscribe from these newsletters at any time.
All fields are required. Username must be unique. Password must be a minimum of 6 characters and have any 3 of the 4 items: a number (0 through 9), a special character (such as !, $, #, %), an uppercase character (A through Z) or a lowercase (a through z) character (no spaces).
Asana vs Planner: Project management software comparison
Your email has been sent
Asana and Microsoft Planner are both popular project management solutions. Compare the features to see which one will help you complete your work on time.
Both Asana and Microsoft Planner are fairly straightforward task management and project management tools. For those within the Microsoft ecosystem, Microsoft Planner provides many advantages in terms of integration. On the other hand, Asana is easy to use, popular and has an exceptional array of features and utilities. Asana and Microsoft Planner are two of the best project management tools on the market. Let’s compare the two project management tools to determine which is best for you and your organization.
Asana is an online task and project management suite. It includes most of the features users expect from their task management tools, enabling them to create subtasks, set deadlines and assign tasks to other people. Users can create multiple workspaces for their projects and even connect to multiple Asana deployments.
Microsoft Planner is an online application and part of the Microsoft Office 365 integrated ecosystem. Through Microsoft Planner, users can track tasks and projects. Features include task groups, swimlanes, deadlines, task assignments and notes.
Asana makes task management simple — and, as far as project management software goes, it’s fairly robust. Some of Asana’s best features include:
Asana does not have some of the more advanced features that Microsoft Planner has, such as task groups and swimlanes, but the Microsoft Planner suite also lacks some important features, such as subtasks.
SEE: How to build a successful project manager career (free PDF) (TechRepublic)
The biggest difference between Asana and Planner is the ecosystem that they are a part of. Asana is not part of the Microsoft ecosystem and does not integrate with other Microsoft products. But Planner is part of Office 365 and integrates with other Microsoft products, such as Outlook and OneDrive.
That being said, Asana does integrate with many third-party solutions, such as Salesforce, Dropbox, Gmail and Power BI.
Microsoft Planner’s integration with the Microsoft ecosystem is its biggest strength. Some of the best features of Microsoft Planner include:
Microsoft Planner lacks some of Asana’s features, such as the ability to create subtasks or easily integrate with third-party solutions.
SEE: Asana Software Review (TechRepublic)
Microsoft Teams is a platform built for both communication and collaboration. It includes chat, video conferencing, file sharing and task management features. Microsoft Planner is solely a task management application. It can be used side-by-side with Microsoft Teams.
SEE: Feature comparison: Time tracking software and systems (TechRepublic Premium)
Asana is typically used by offices that do not use Office 365, offices that operate remotely or offices just searching for a simple and affordable task management suite. Microsoft Planner is mainly used by businesses that are already using Office 365.
Asana integrates with many third-party solutions, such as Salesforce, Dropbox, Gmail and Power BI. Microsoft Planner integrates with other Microsoft products, such as Outlook and OneDrive. For organizations that need to integrate with third-party solutions that Microsoft does not produce, Asana has a substantial edge.
Asana offers a few support options, including a knowledge base, community forum and email support. Microsoft Planner provides support through the Office 365 support website. Asana’s support is more comprehensive than Microsoft Planner’s, but both platforms offer solid support and have active communities.
Asana has a free basic plan and several paid premium plans. Most employees will only need the basic plan. Microsoft Planner is part of Office 365, which has various subscription plans. The cheapest Office 365 plan that includes Microsoft Planner is $5 per user per month.
Asana is less expensive for individuals and teams who do not need the full suite of Microsoft products. For organizations using Office 365, the cost of Microsoft Planner is negligible.
Asana and Microsoft Planner are both simple project management tools, although Microsoft Planner may be less intuitive for users who are not familiar with the Microsoft ecosystem. Those familiar with Microsoft products should be able to begin using Microsoft Planner immediately.
Asana and Microsoft Planner are different enough that an answer should immediately become apparent. When choosing the best project management software, consider:
The benefits of Microsoft Planner somewhat wane if you aren’t already using Office 365. And if you are already using Office 365, it only makes sense to use a product already included and integrated.
Discover the secrets to IT leadership success with these tips on project management, budgets, and dealing with day-to-day challenges.
Asana vs Planner: Project management software comparison
Your email has been sent
Your message has been sent
TechRepublic Premium content helps you solve your toughest IT issues and jump-start your career or next project.
Windows 11 gets an annual update on September 20 plus monthly extra features. In enterprises, IT can choose when to roll those out.
Edge AI offers opportunities for multiple applications. See what organizations are doing to incorporate it today and going forward.
This is a complete guide for Apple’s iPadOS. Find out more about iPadOS 16, supported devices, release dates and key features with our cheat sheet.
Discover data intelligence solutions for big data processing and automation. Read more to explore your options.
Whether you are a Microsoft Excel beginner or an advanced user, you’ll benefit from these step-by-step tutorials.
Edge computing is an architecture intended to reduce latency and open up new applications. The terms around it can be fluid, but are helpful to know. From the glossary’s introduction: Edge computing is an architecture which delivers computing capabilities near the site where the data is used or near a data source. In an idealized …
This document helps make sure that you address data governance practices for an efficient, comprehensive approach to data management. This checklist from TechRepublic Premium includes: an introduction to data governance, a data governance checklist and how to manage a data governance checklist. From this checklist’s introduction: Data governance is the process by which an organization …
Recruiting a Scrum Master with the right combination of technical expertise and experience will require a comprehensive screening process. This hiring kit provides a customizable framework your business can use to find, recruit and ultimately hire the right person for the job. This hiring kit from TechRepublic Premium includes a job description, sample interview questions …
Knowing the terminology associated with Web 3.0 is going to be vital to every IT administrator, developer, network engineer, manager and decision maker in business. This quick glossary will introduce and explain concepts and terms vital to understanding Web 3.0 and the technology that drives and supports it.

Since the COVID-19 pandemic began, remote and hybrid workplaces have become popular. Many interactions and collaboration between team members quickly became and still remain virtual.
During the pandemic, Microsoft promoted its 365 product suite as the go-to platform for virtual interactions. The vendor also saw its customers embrace services like Teams and SharePoint for remote work and collaboration. Then, in 2021, Microsoft introduced a new app for remote work and collaboration called Microsoft Loop.
But what is Microsoft Loop, and how different is it from SharePoint for content management and collaboration?
Organizations consider SharePoint an intranet service that supports enterprise content storage and management. Features like file sharing, versioning, delivery and custom list creation have helped employees access corporate data from anywhere using a browser or a mobile app.
SharePoint offers several components to support collaboration, including the following:
Sixteen years after the birth of SharePoint, the need for real-time collaboration brought forth Teams, Microsoft’s team collaboration software. Teams incorporates video and audio conferencing, real-time chat and SharePoint to store content.
After organizations increased their adoptions of SharePoint and Teams amid the pandemic, Microsoft introduced a product called Loop in an attempt to better fit remote work and collaboration needs.
With Loop, users can interact with and update content in different Microsoft platforms, like Outlook, Teams, SharePoint, OneNote and Word. Those platforms then reflect the changes, as Loop maintains one version of the content, regardless of the platform.
Loop has three main features: pages, workspaces and components.
Some users may view the pages feature as similar to OneNote. However, Loop pages enable users to insert live data and components from different sources in real time, which OneNote doesn’t.
Elements within Loop pages include files, links or data from Dynamics 365 and other Microsoft 365 platforms.
Loop workspaces act like Microsoft’s content explorer. They let users store critical documents and Loop components in one place. Users can see the content they work on for specific projects, and Loop workspaces enable them to interact, share ideas and collaborate on different content asynchronously and synchronously. This feature can help organize all the items teams work on together.
Loop components can be tables, bulleted lists, checklists, paragraphs or task lists that users can edit, and the components stay up to date in connected tools, like Word, Outlook or Teams. Components’ real-time updates mean users can see the same information in the components across platforms.
Loop components are also interactive, as users can view them to see who authored the content and update them in real time.
Microsoft Loop may seem to perform the same activities as SharePoint in regard to content storage, but Loop introduces a new collaboration experience where content — regardless of its location or format — can cross into multiple Microsoft 365 apps.
The key differences between Loop and SharePoint are the following:
While it is still too early to tell how successful Loop’s adoption might be, Loop’s current components seem to give enough functionality for users to take advantage of it.
Part of: Introduction to Microsoft Loop
Microsoft plans to release Loop this year as the long-awaited information-sharing tool across 365 apps. The software reduces the time spent searching for vital data.
As most organizations now have hybrid workers, virtual collaboration is a priority. Here’s how integrating Microsoft Teams with Loop components can enable effective collaboration.
Microsoft’s announcement of Loop came with various questions — in particular, how the new product compares to legacy products, like SharePoint. Here, find out how the two differ.
While Microsoft Loop is not yet generally available, Microsoft has released details about how Loop can connect users and projects across the Microsoft 365 service.
The combination of the analytics vendor’s NLP-based platform with the spreadsheet is designed to help joint customers derive …
Data analytics pipelines bring a plethora of benefits, but ensuring successful data initiatives also means following best …
The analytics vendor plans to use the capital to build up an ecosystem for analytics through new integrations and develop …
The startup’s technology aims to help enterprises liberate data from applications where it can be locked so users can more easily…
InfluxData updated its InfluxDB Cloud database service with a new engine, new storage and real-time data capabilities, and …
Data quality challenges pose a threat to organizations’ decision-making. Inaccurate, inconsistent, missing and duplicate data …
In this Q&A, Stephen Keys of IFS discusses why sustainability projects for organizations are complex undertakings, but the data …
Some companies may require CRM software in addition to their ERP system. Learn more about CRM vs. ERP and whether your company …
The industrial sector has a massive carbon footprint. That’s why some companies are working to clean up steel and cement and find…
With its Cerner acquisition, Oracle sets its sights on creating a national, anonymized patient database — a road filled with …
Oracle plans to acquire Cerner in a deal valued at about $30B. The second-largest EHR vendor in the U.S. could inject new life …
The Supreme Court ruled 6-2 that Java APIs used in Android phones are not subject to American copyright law, ending a …
SAP Multi-Bank Connectivity has added Santander Bank to its partner list to help companies reduce the complexity of embedding …
Over its 50-year history, SAP rode business and technology trends to the top of the ERP industry, but it now is at a crossroads …
Third-party support providers make a pitch that they can provide greater flexibility at a lower cost, but customers should think …
All Rights Reserved, Copyright 2011 – 2022, TechTarget
Privacy Policy
Cookie Preferences
Do Not Sell My Personal Info